This classic graphical tool is now rarely used, but there is one application where it still reigns.
Back in the “BC” era (before calculators/computers), calculations associated with basic engineering situations were hard to do, especially if they involved multiple steps, variables, or non-linear factors. Basic calculations involved commonly needed functions such as the volume of water flow through a pipe of a given diameter at a known pressure, or the inductance of a single-layer coil made of a specific number of turns with a defined diameter and wire gauge.
In some cases, the results are needed to a precision of three or perhaps even four digits; in many real-world cases, however, a rougher assessment to just two and maybe a third digit is sufficient for estimating and planning purposes. Also, there are situations where the designer wants to go the “what if?” route and explore the tradeoffs and effects of changing one or more variables. For example, a designer might want to understand “if I use heavier-gauge wire, what diameter coil and number of turns would I use to maintain the same inductance?”
The obvious way to address these issues now is to do the calculation once or even multiple times, or perhaps set up a spreadsheet if a standard app isn’t available. But back in the pre-digital calculation days, that was time-consuming and often did not provide broader insight.
That’s why nomographs — also called nomograms; we’ll stick with nomograph — were widely used. These are application- and equation-specific graphic representations of the variables, laid out so that the user can mark the known variable and then use a ruler to link them, highlighting the answer to the problem. These handy “analog” engineering tools were used across all engineering disciplines as well as many medical and industrial situations. They could “solve” linear, inverse, quadratic, cubic, and trigonometric relationships.
Although nomographs for “analog” calculations are now largely obsolete, one of their many virtues was that the user did not have to know how to solve algebraic equations, look up data in tables, or substitute numbers into equations to obtain results (admittedly, there are now apps that do all this for you). The user does not even need to know the underlying equation the nomogram represents, which is both good and bad.
Nomographs are typically used in applications for which the modest level of accuracy they provide is sufficient and useful. Reality is that many real-world engineering situations require an answer that’s accurate to only a few percent, especially in their first-level analysis.
Further, nomographs help the designer easily explore “what if” scenarios to see the effects of varying one or more variables at the same time. This provides an indication of outcome sensitivity around nominal values – a very important factor in many designs.
Finally, they can act as a cross-check (sometimes referred to as a “sanity check”) on an answer or calculation as they help designers be “roughly right” rather than precisely wrong – an easy mistake to make with a misleading model that is bolstered by high-precision calculations. The graphical representation offers perspective beyond just plugging in the numbers and accepting the results with a “yeah, sure, that makes sense” naivety.
A nomogram provides a fast, easy, accurate, and reasonably precise way to solve a problem visually or see the impact of changing a variable on the larger picture. Nomographs were so popular that major publications such as Popular Electronics, Radio-TV, and Electronics World featured a new one in every issue, then often combined them into a book (see [1]). These nomographs covered basic electronic engineering issues such as decibel voltage and power conversions, filter designs, thermal dissipation and heat flow, attenuation curves, and more.
According to Wikipedia, nomographs were invented in 1884 by the French engineer Philbert Maurice d’Ocagne (1862–1938) for solving volume-of-soil displacement equations in earth-moving situations. I know Wikipedia is not always correct, but the article does cite a paper he published on the topic in 1899, so there’s some credibility.
Start with a basic example
For most electrical engineers back in those days, their “go-to” nomograph was the one that showed the total resistance RT of two known resistors R1 and R2 placed in parallel. This very common circuit configuration is defined by a modest equation:
RT = (R1 × R2)/R1 + R2)
The nomogram for this can be created in several ways, with one format shown in Figure 1.
This nomograph can be used to find the value of two known resistors in parallel, or determine what value resistor must be placed in parallel with a known one to yield a desired value.
For the first case, to find the resistance of 560 kΩ (R1) in parallel with 130 kΩ (R2), simply place or draw a straight line across from the first value on the R1 scale to the second value on the R2 scale. The paralleled value of 90 kΩ is seen instantly where the line crosses the RT line between the R1 and R2 scales.
The same nomographs are also very useful for solving the inverse problem: what value of a resistor is needed to shunt a 560 kΩ resistor to get a parallel value of 390 kΩ? Place or draw a straight-edge across the three scales crossing 56 kΩ on the R2 scale and 39 kΩ on the RT scale. The solution is the point where the straight edge crosses the R1 scale; in this case, it crosses just below the 130 kΩ value.
You have to admit, this is quick and easy!
A more complicated nomograph
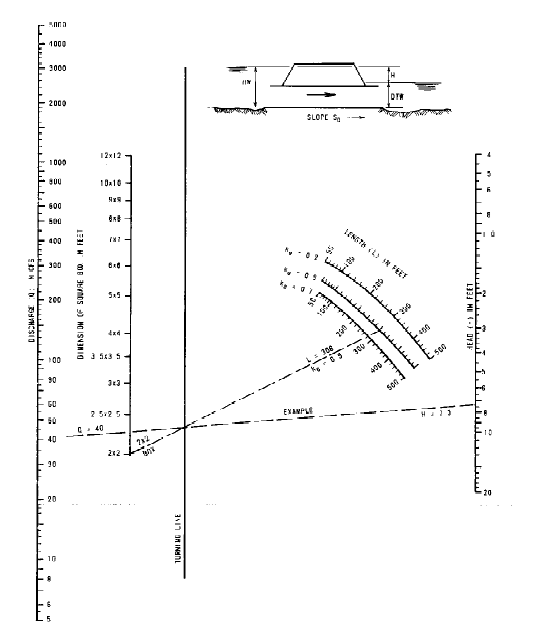
Non-electronic publications and handbooks for mechanical engineering, construction, and hydraulic engineering (to cite a few disciplines) also had useful nomographs. For example, a nomograph is used by hydraulic engineers to quickly estimate the pressure of water flowing through a culvert, which can be modeled by the pipe-flow formula [2]:
![]()
A culvert is a tunnel or enclosed channel that allows water to flow under a road, railway, or other obstruction, providing a pathway for water to pass from one side of an embankment to the other.
Where:
H = total head, ft.
ke = entrance loss coefficient for a given inlet. Design values for the coefficient “ke” are given in a separate “Entrance Loss Coefficients Table”
n = the roughness coefficient of the culvert barrel. Design values for the coefficient “n” are given in the separate table “Roughness Coefficients for Various Materials Table” and EPG 750.1.4.1.1, “Composite Roughness.”
L = length of culvert barrel, ft.
R = hydraulic Radius of the culvert barrel, ft.
Q = the culvert discharge in ft3/s
A = culvert waterway area in ft2
While this can easily be calculated with an app on a PC or smartphone, the nomograph of Figure 2 gives a quick answer as well as better insight into the interplay among parameters and the effect of changing a parameter value.
The Smith chart
There is one nomograph that is still widely used in RF design: the Smith chart, as shown in Figure 3.

This chart, devised in the 1930s by William Smith, uses polar coordinates and is among the primary analytical tools that designers use for analyzing transmission lines or RF circuit impedance and relationships, impedance matching and transformation, and for providing insight into circuit stability and other operating factors.
Among its many visualizations, this admittedly non-intuitive chart shows the present impedance status and the paths that are available to match impedances using inductors and capacitors. Of course, the chart is now almost always used on a screen, often in conjunction with a network analyzer, rather than paper, but its principle is unchanged, and its usefulness is still unmatched.
Even the medical profession makes use of nomographs. For basic statistics, they are used to determine how many samples (people) are needed to have a defined level of confidence in medical tests. Further, special nomographs are used, for example, to assess probabilities of success and survival in cancer treatments, as there are many medical variables “in motion” at the same time (see [3]).
By graphically representing the effect of each predictor on the outcome, a doctor can “estimate” the sum of all predictors’ effect for a given patient and predict the probability of 1-, 3-, and 5-year survivals. A nomograph can be a useful tool to present and help understand clinical prediction models. This is easier than programming the formula in the computer beforehand or pulling out a phone and typing all the coefficients manually, which is likely to induce mistakes.
Conclusion
There’s no denying that nomographs/nomograms no longer have a major role in assisting designers in their engineering analyses. Nonetheless, the power and convenience of this classic graphical approach to solving equations should be recognized for its power and convenience in providing insight. The one nomograph still in widespread use, the Smith chart, is clear evidence of how a graphical tool can provide both “analog” computation as well as understanding of design issues and their many parameters and paths to completion.
References
[1] Electronic Engineering Nomograms, Tab Books
[2] Culverts, Missouri Department of Transportation, Engineering Policy Guide,
[3] Nomogram: An analogue tool to deliver digital knowledge, Elsevier/Journal of Thoracic and Cardiovascular Surgery
[4] Use of nomographs for determining sample size, Science Direct
[5] Nomograms, Wikipedia
[6] Pressure-Temperature Nomograph, TCI Chemicals
[7] Parallel Series Resistance Calculator, RF Café
[8] Nomograph Construction – Part 1, RF Cafe
Related EE World content
Nomogram helps engineer calculate transformer parameters
Tire pressure, slide rules, and the art of the estimate
First go for accuracy, then precision
Analog computation, Part 1: What and why
Analog computation, Part 2: When and how
What is a Smith Chart and why do I need one? (Part 1)
What is a Smith chart and why do I need one? (Part 2)
Impedance matching and the Smith chart, Part 1
Impedance matching and the Smith chart, Part 2